


Published October 10, 2026
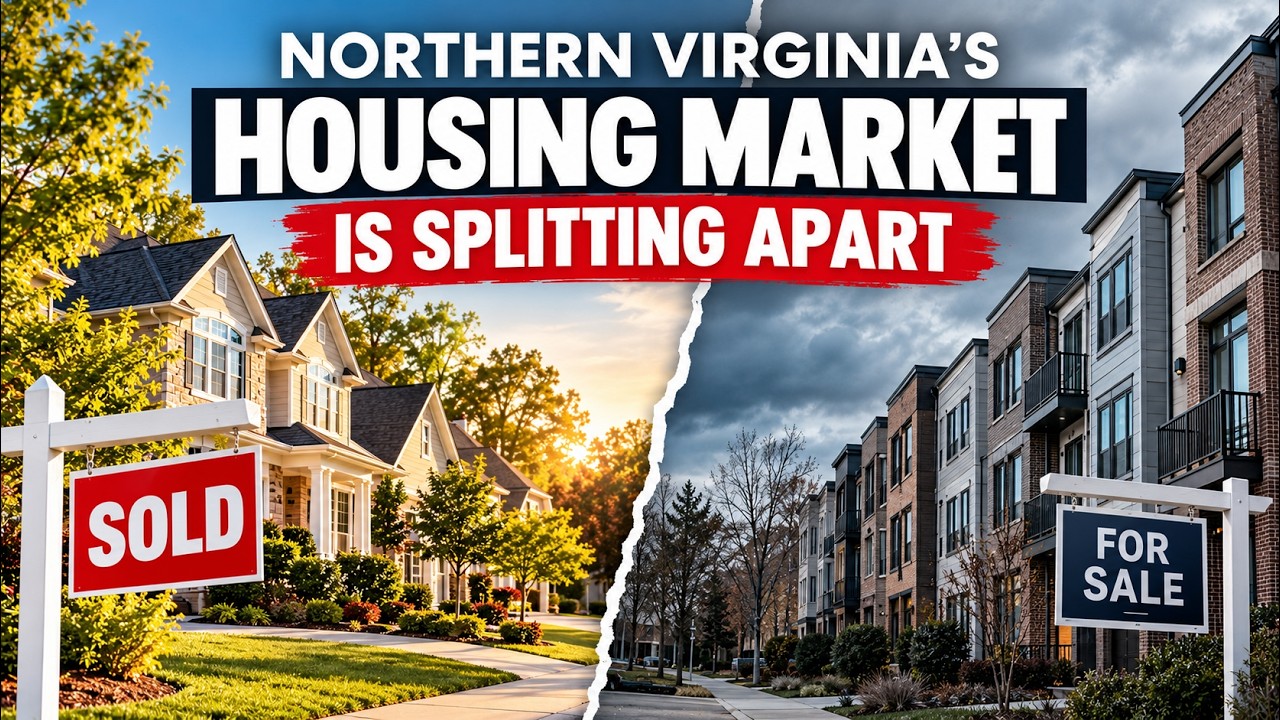
Summary answer: Northern Virginia is not one housing market. Regionally, inventory is up, closed sales are down, and mortgage rates have climbed back above 7%, yet in some zip codes homes are still selling faster than last year. Condos, townhomes and detached homes are behaving differently, and so are neighboring zip codes. The most useful question is not "how is the Northern Virginia market?" but "what is happening to homes like mine, in my neighborhood, at my price point?"
I'm Johnny with JQ Real Estate. Here is a contradiction I came across in the data: in one Fairfax zip code, the number of homes for sale jumped 43% from the previous year, and yet homes there are selling five days faster. Let's unpack how both things can be true.
What the Northern Virginia Headline Numbers Say
According to the Northern Virginia Association of Realtors (NVAR), active listings in August 2026 totaled 2,932, up 18.5% from August 2025. Closed sales fell 8.0% to 1,324. The median sold price was $765,000, up 2.0%. More inventory, fewer sales, and prices still rising slightly.
But the more important number is how that inventory is split by property type:
| Property Type | Inventory Change vs. Last Year |
|---|---|
| Condos | +44.8% |
| Townhomes | +29.9% |
| Detached homes | -8.5% |
A condo shopper suddenly has far more options. Someone hunting for a detached house in a desirable neighborhood may still face very limited choices. Both are "shopping in Northern Virginia," yet they are in completely different markets.
Zip Code 22033: More Inventory, Faster Sales
In the three-month period ending in July, my analysis showed 83 homes for sale in Fairfax zip code 22033. Inventory was up 43.1% from the prior year, yet median days on market were just 23, five days faster than before. About 62% of homes went under contract within two weeks.
Compare that with Fairfax County as a whole. September listing data showed roughly 2,456 listings versus 1,950 a year earlier, an increase of about 26%. Median days on market rose from 29 to 36. Across the county, homes were generally taking longer to sell. In 22033, they were moving faster.
Neighboring Fairfax Zip Codes Are Different Markets
Move just a few zip codes over and the differences become clearer. Here is the same three-month dataset:
| Zip Code | Median Sale Price | Median Days on Market |
|---|---|---|
| 22030 | ~$764,000 | 28 |
| 22031 | ~$735,000 | 24 |
| 22032 | ~$900,000 | 21 |
| 22033 | ~$735,000 | 23 |
22032 had only 57 homes for sale, while 22033 had 83. Same general part of Northern Virginia, different price points, different available inventory, different marketing times. That is why "the Fairfax market is slowing down" can be misleading.
Why Northern Virginia Has So Many Distinct Markets
Northern Virginia was never developed as one uniform market. Fairfax County's population grew from roughly 99,000 in 1950 to about 596,000 in 1980. That kind of growth required wave after wave of subdivisions, schools, shopping corridors and infrastructure, and it did not produce identical neighborhoods. Housing styles, lot sizes, age of construction, transportation access, proximity to employment and price points all vary, and those differences still shape how each area behaves today.
Prince William County: Woodbridge 22193
September data put Prince William County's median asking price at about $600,000, compared with roughly $725,000 in Fairfax County. But countywide numbers only tell part of the story. In Woodbridge zip code 22193, for the three months ending in July:
| Metric | 22193 (Woodbridge) |
|---|---|
| Homes sold | 285 |
| Median sale price | ~$540,000 (up 3.6%) |
| Median days on market | 30 (four days faster) |
| Months of supply | 1.7 |
| Under contract within two weeks | 58.4% |
| Average list-to-sale price ratio | ~100.2% |
Homes there were selling for essentially their asking price, and more than half went under contract within two weeks. That is not what you would expect when you hear that inventory is rising and rates are above 7%.
Prince William County also grew rapidly after World War II, from about 22,000 people in 1950 to 50,000 in 1960 and 100,000 by 1970. Developer Cecil Hilton built thousands of practical, affordable homes in the Woodbridge area for middle-class families. That history does not prove why any zip code performed the way it did recently, but it helps explain why Fairfax and Woodbridge should not be expected to behave identically.
What This Means for Sellers
If you are selling, don't assume prices are falling just because regional inventory is up almost 20%. And don't assume you can price aggressively because a nearby zip code is moving quickly. Your buyer is comparing your home against the specific alternatives available today.
If you are selling a condo and comparable condo inventory has increased substantially, your competition may look very different from a year ago. If you are selling a detached home in a neighborhood with little comparable inventory, you may be in a tighter market. To know where you stand, look at the homes competing directly with yours: their condition, pricing, location, time on market, price reductions, and what comparable homes have actually sold for.
Rates add pressure. Freddie Mac reported the 30-year fixed rate at 7.28% as of October 1, 2026, up from 7.03% the week before and 6.34% a year earlier. When buyers borrow at those rates but have more choices than they did when inventory was extremely tight, they weigh condition, repairs, layout and location more heavily. A home priced above competing properties will have a harder time justifying the premium.
What This Means for Buyers
More inventory does not mean every seller is desperate. In the zip code data I analyzed, roughly half of the homes in several Fairfax zip codes were still selling above asking price, and in Woodbridge's 22193 more than half went under contract within two weeks. Competitive situations still exist.
Consider two homes. The first has been on the market 45 days, has had multiple price reductions, and faces several comparable alternatives. You may have real room to negotiate. The second came on the market three days ago, is priced correctly, sits in a neighborhood with little comparable inventory, and is attracting attention. Approaching that seller as if the home has been sitting unwanted for months could cost you the house. The opposite mistake is just as costly: treating every property like a bidding war can lead you to overpay for a home with very little competition.
The Bottom Line
So how can Northern Virginia have more inventory, fewer sales, higher mortgage rates, and still have neighborhoods where homes sell quickly? Because those numbers describe different parts of a much larger market. The region is moving away from the extreme inventory shortage that defined much of the post-pandemic market, buyers are more selective, and financing costs are squeezing affordability. But Fairfax County is not one market, Prince William County is not one market, and sometimes even neighboring zip codes are not the same market. Averages tell you the direction. They don't tell you what you need to know to buy or sell a particular home.
Want to See the Numbers for Your Neighborhood?
If you are buying or selling in Northern Virginia and want to know what the numbers look like where you live, not just the county average, that is exactly what I track. Reach out to me at JQ Real Estate and I will walk you through what is happening with homes like yours.
Explore more local market insights on our Fairfax County real estate page.
Posted in Market Updates